Increasing user response 3x without using a computer
An analog card sort to reveal multi-dimensional qualitative data

Thomson Reuters
Skills:
User testing
User test scripting
User test design
User interviews
Custom data mapping/database creation
Custom data reporting
Results analysis & recommendations
Tools:
InDesign
Spreadsheets
Microsoft Power BI
Ninox Database
Background
The product owner and product team wanted to introduce a new update to the product that would dramatically speed up tax research and reporting for certified tax accountants. When is the best time to talk to users as they work? Is there even a best time?
I determined that understanding user workflow (tasks) and the products they use to accomplish these tasks can help to reveal when related products and features might be shown to users in a way that respects a user’s time and attention but fits the context of the work at hand.
This test was performed over two days at a conference where attendees had limited time for user tests. The test had to take less than 10 minutes for a user to complete. Users would need to quickly create their own workflow tasks and associate products with those tasks.
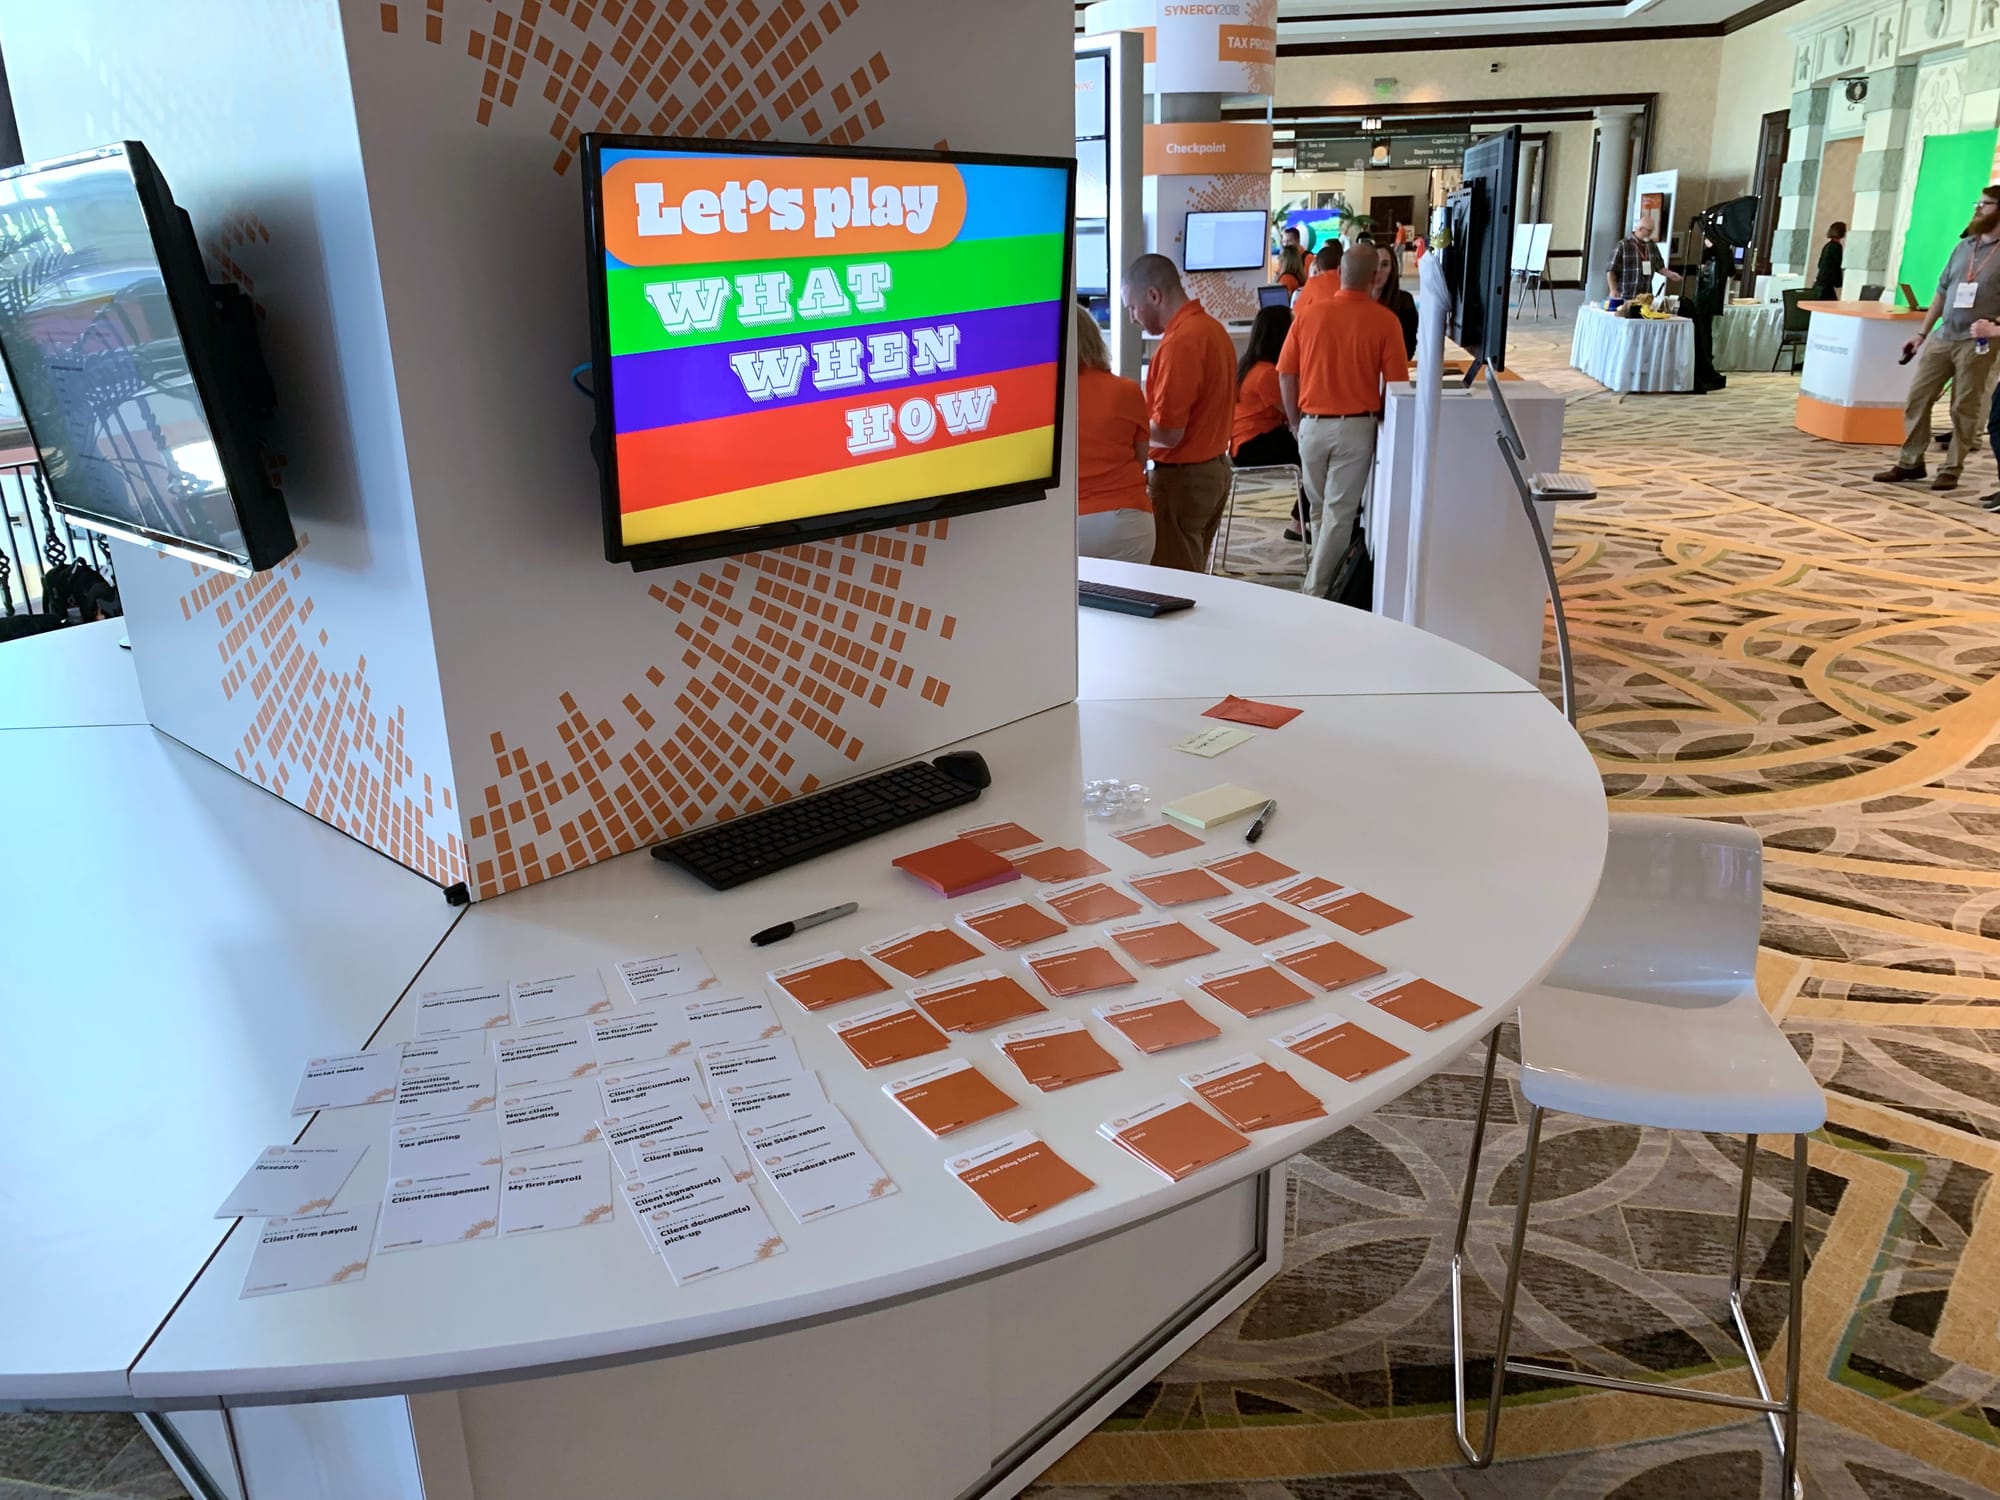
Card sort setup in a prime location
Goals & Materials
Objectives
- Discover user workflows and products they use to complete their work
- Understand potential for 3rd party integrations
- Measure what people do, when they do and how they get it done
Tools
- Using existing brand look/feel, create
- 174 custom product cards from a product list and make duplicates of the most common products; less formal approach so respondents wouldn’t feel pressured into organizing to match Thomson Reuters product matrix
- 100 custom workflow cards based on past user interviews to determine most common/likely tasks
- Post-it notes and markers to fill in any blanks
- Structure a database for all the datapoints: Role, Workflow timeline, Products used on the workflow timeline per user
- PowerBI for some data reporting
Questions to explore
- How do customers use our products (or other products) in terms of workflow?
- How can we cross-market new products and new product features in our legacy application without marketing messages being obnoxious or tone deaf?
- What software do they use?
- Which software products do they use in their overall workflow?
- Is there an average / normal workflow?
- Are there patterns we could leverage?
Challenges
- Time: potential participants had limited time during the day for user testing
- Test had to able to be completed in under 10 minutes
- Getting people to agree to participate in a public setting
- Location and setup for the test; needs a lot of room to conduct
- Creating a fun, Vegas-lite vibe; there are cards on a table, but no wagering
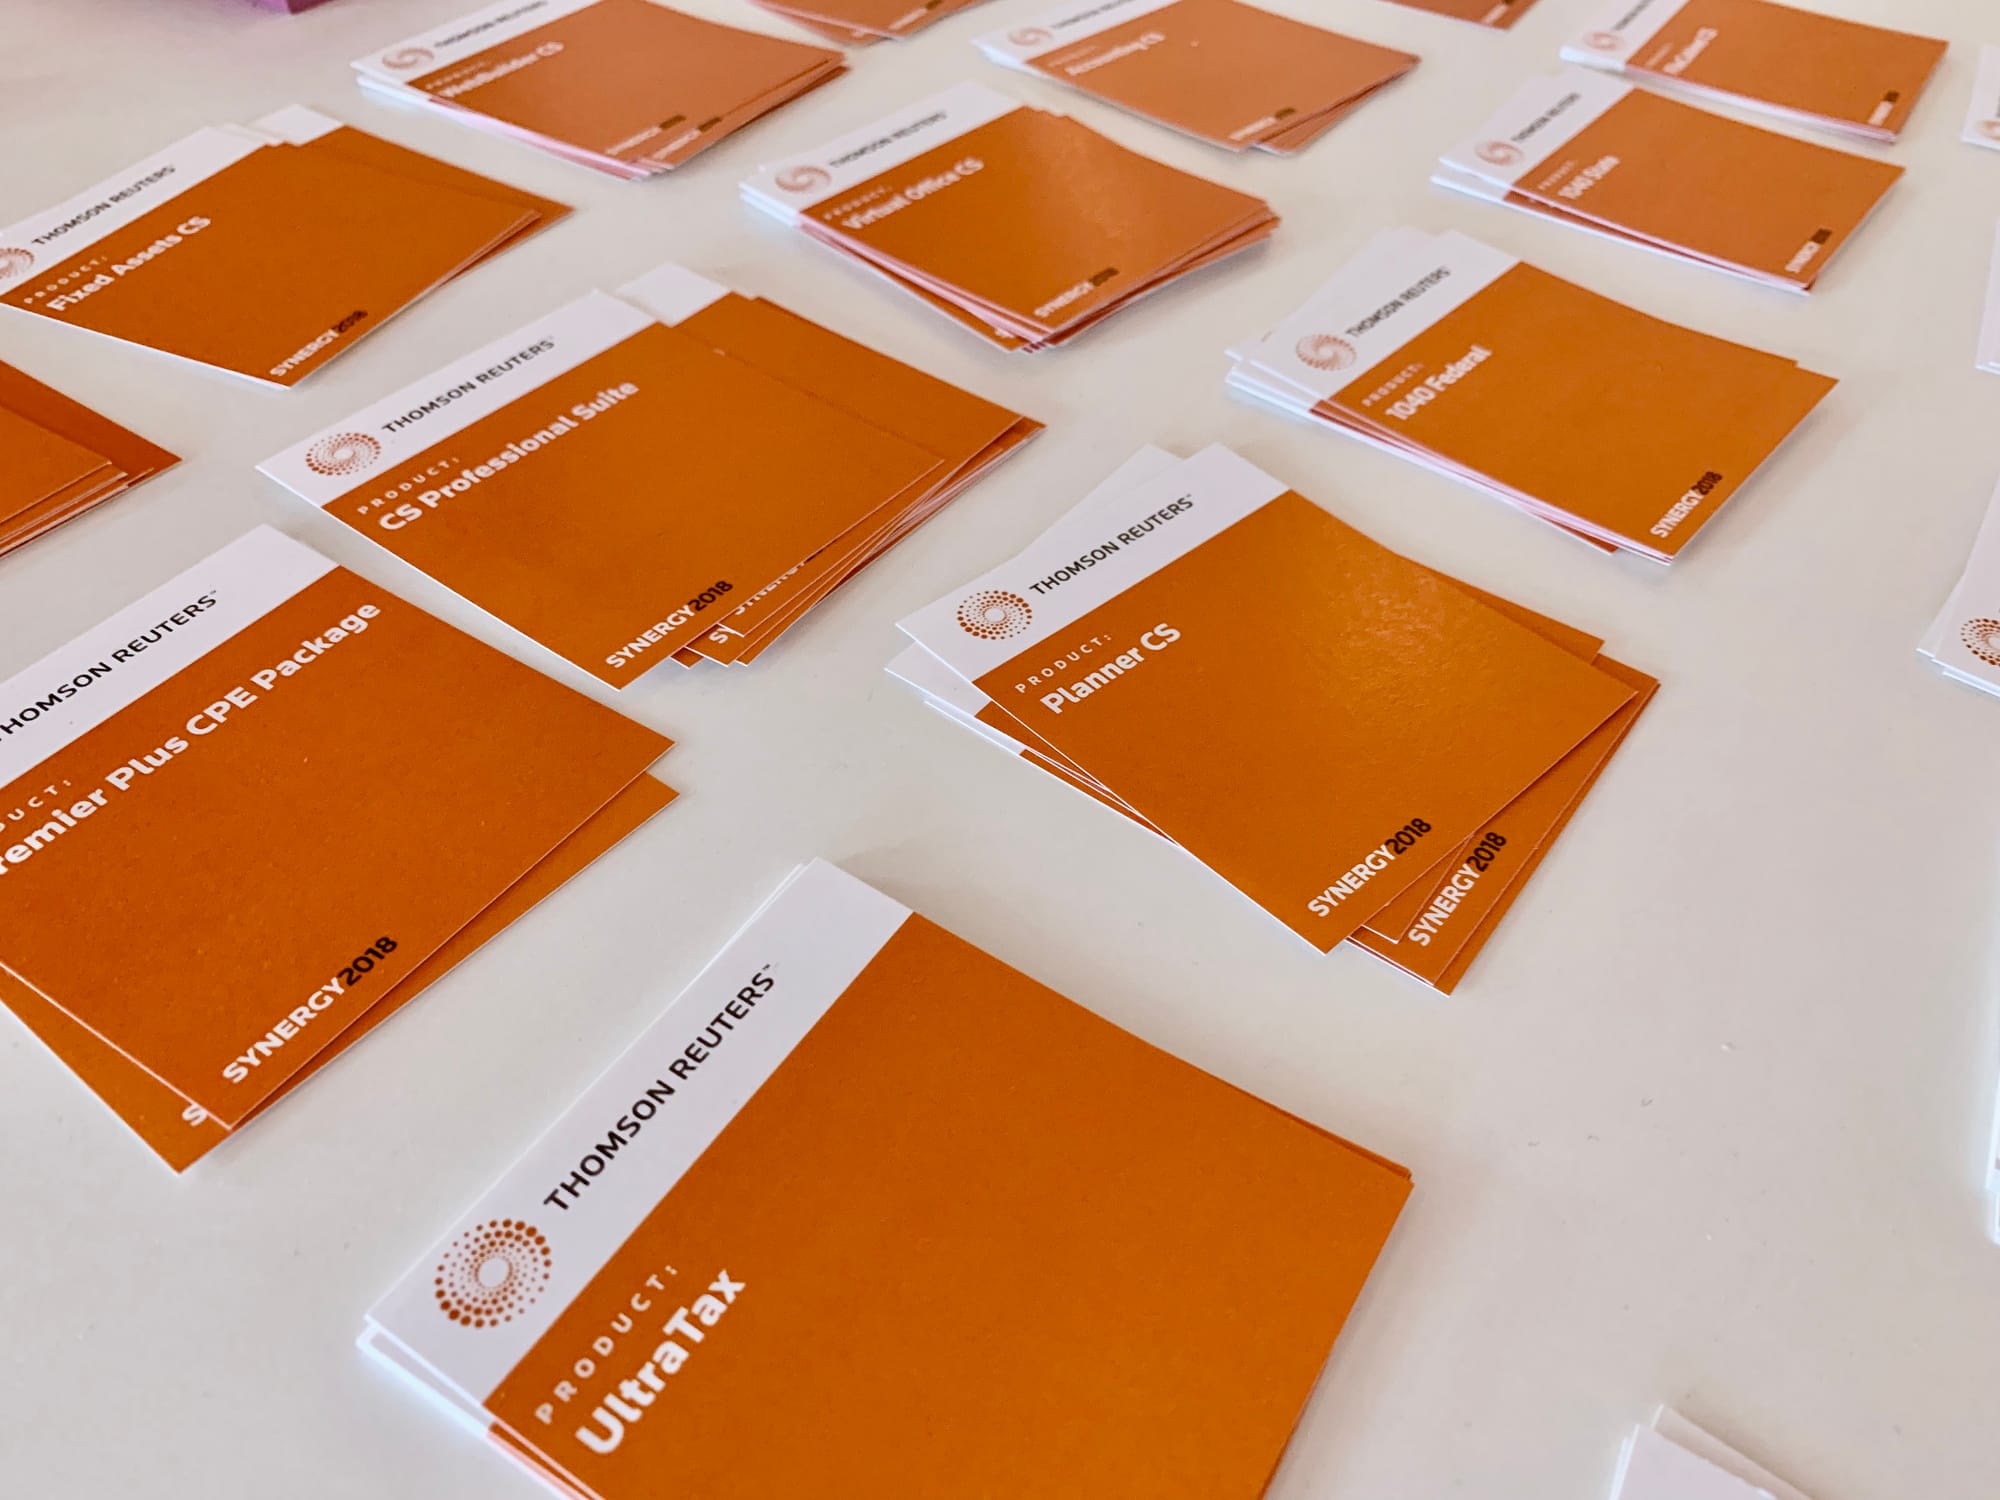
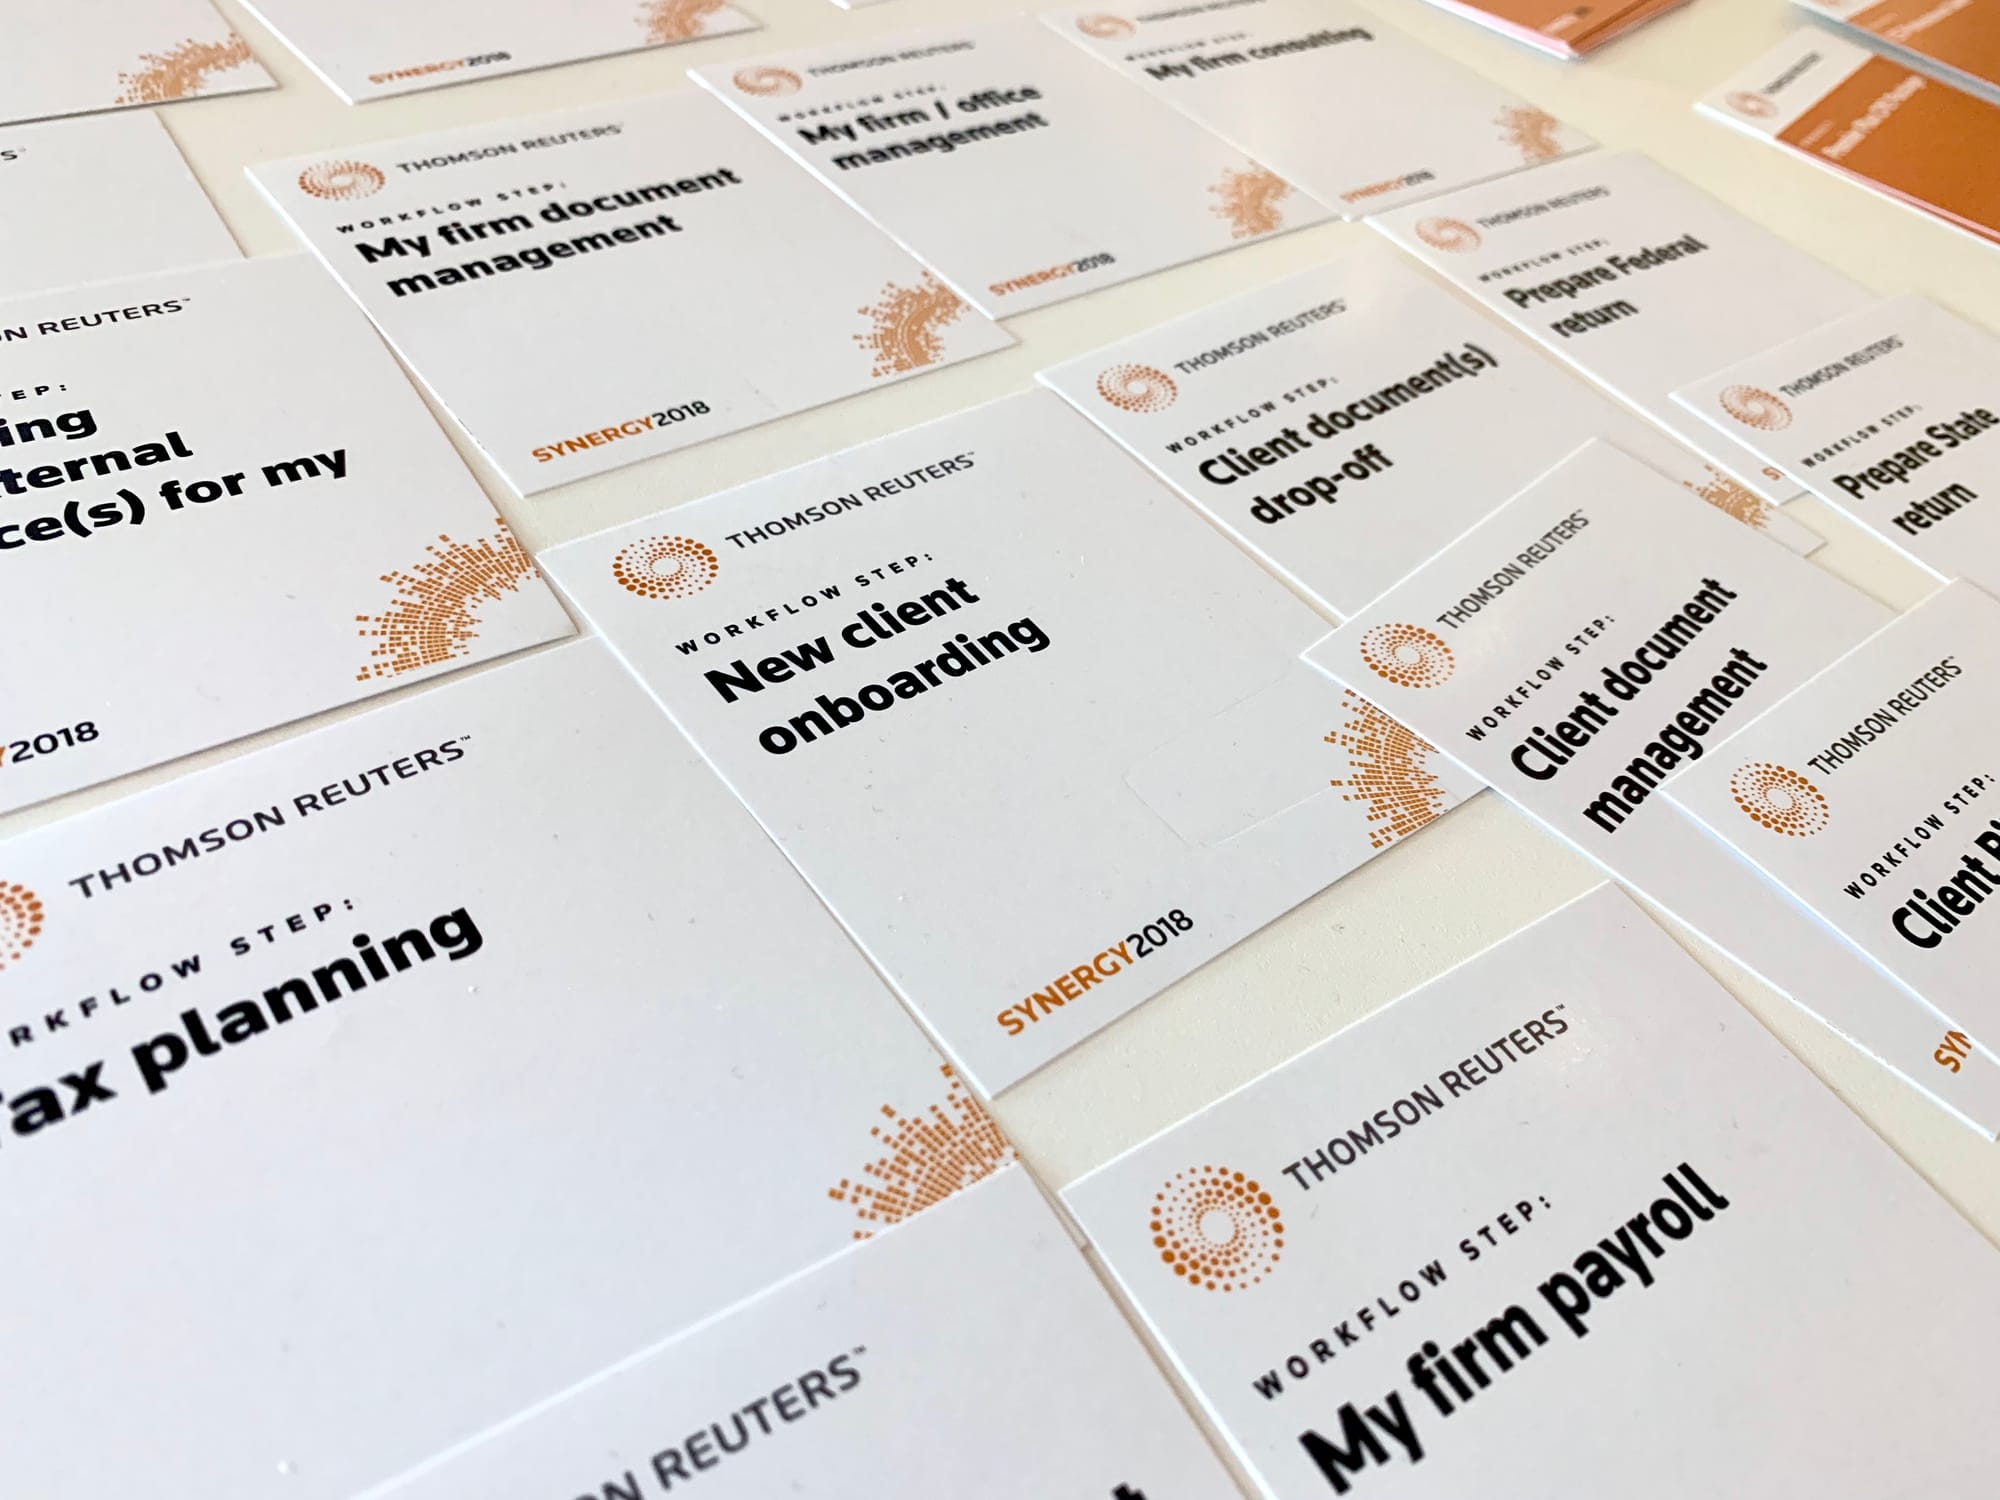
Testing plan
- Perform the test in two steps: having users to recreate their workflow with task cards and then having them match products to those tasks
- Photograph the resulting workflow and product cards
- Input data and analyze
Testing
Some users had few tasks, but used a lot of products to perform those tasks. Others had more than a few tasks, but only used a single product for each task.
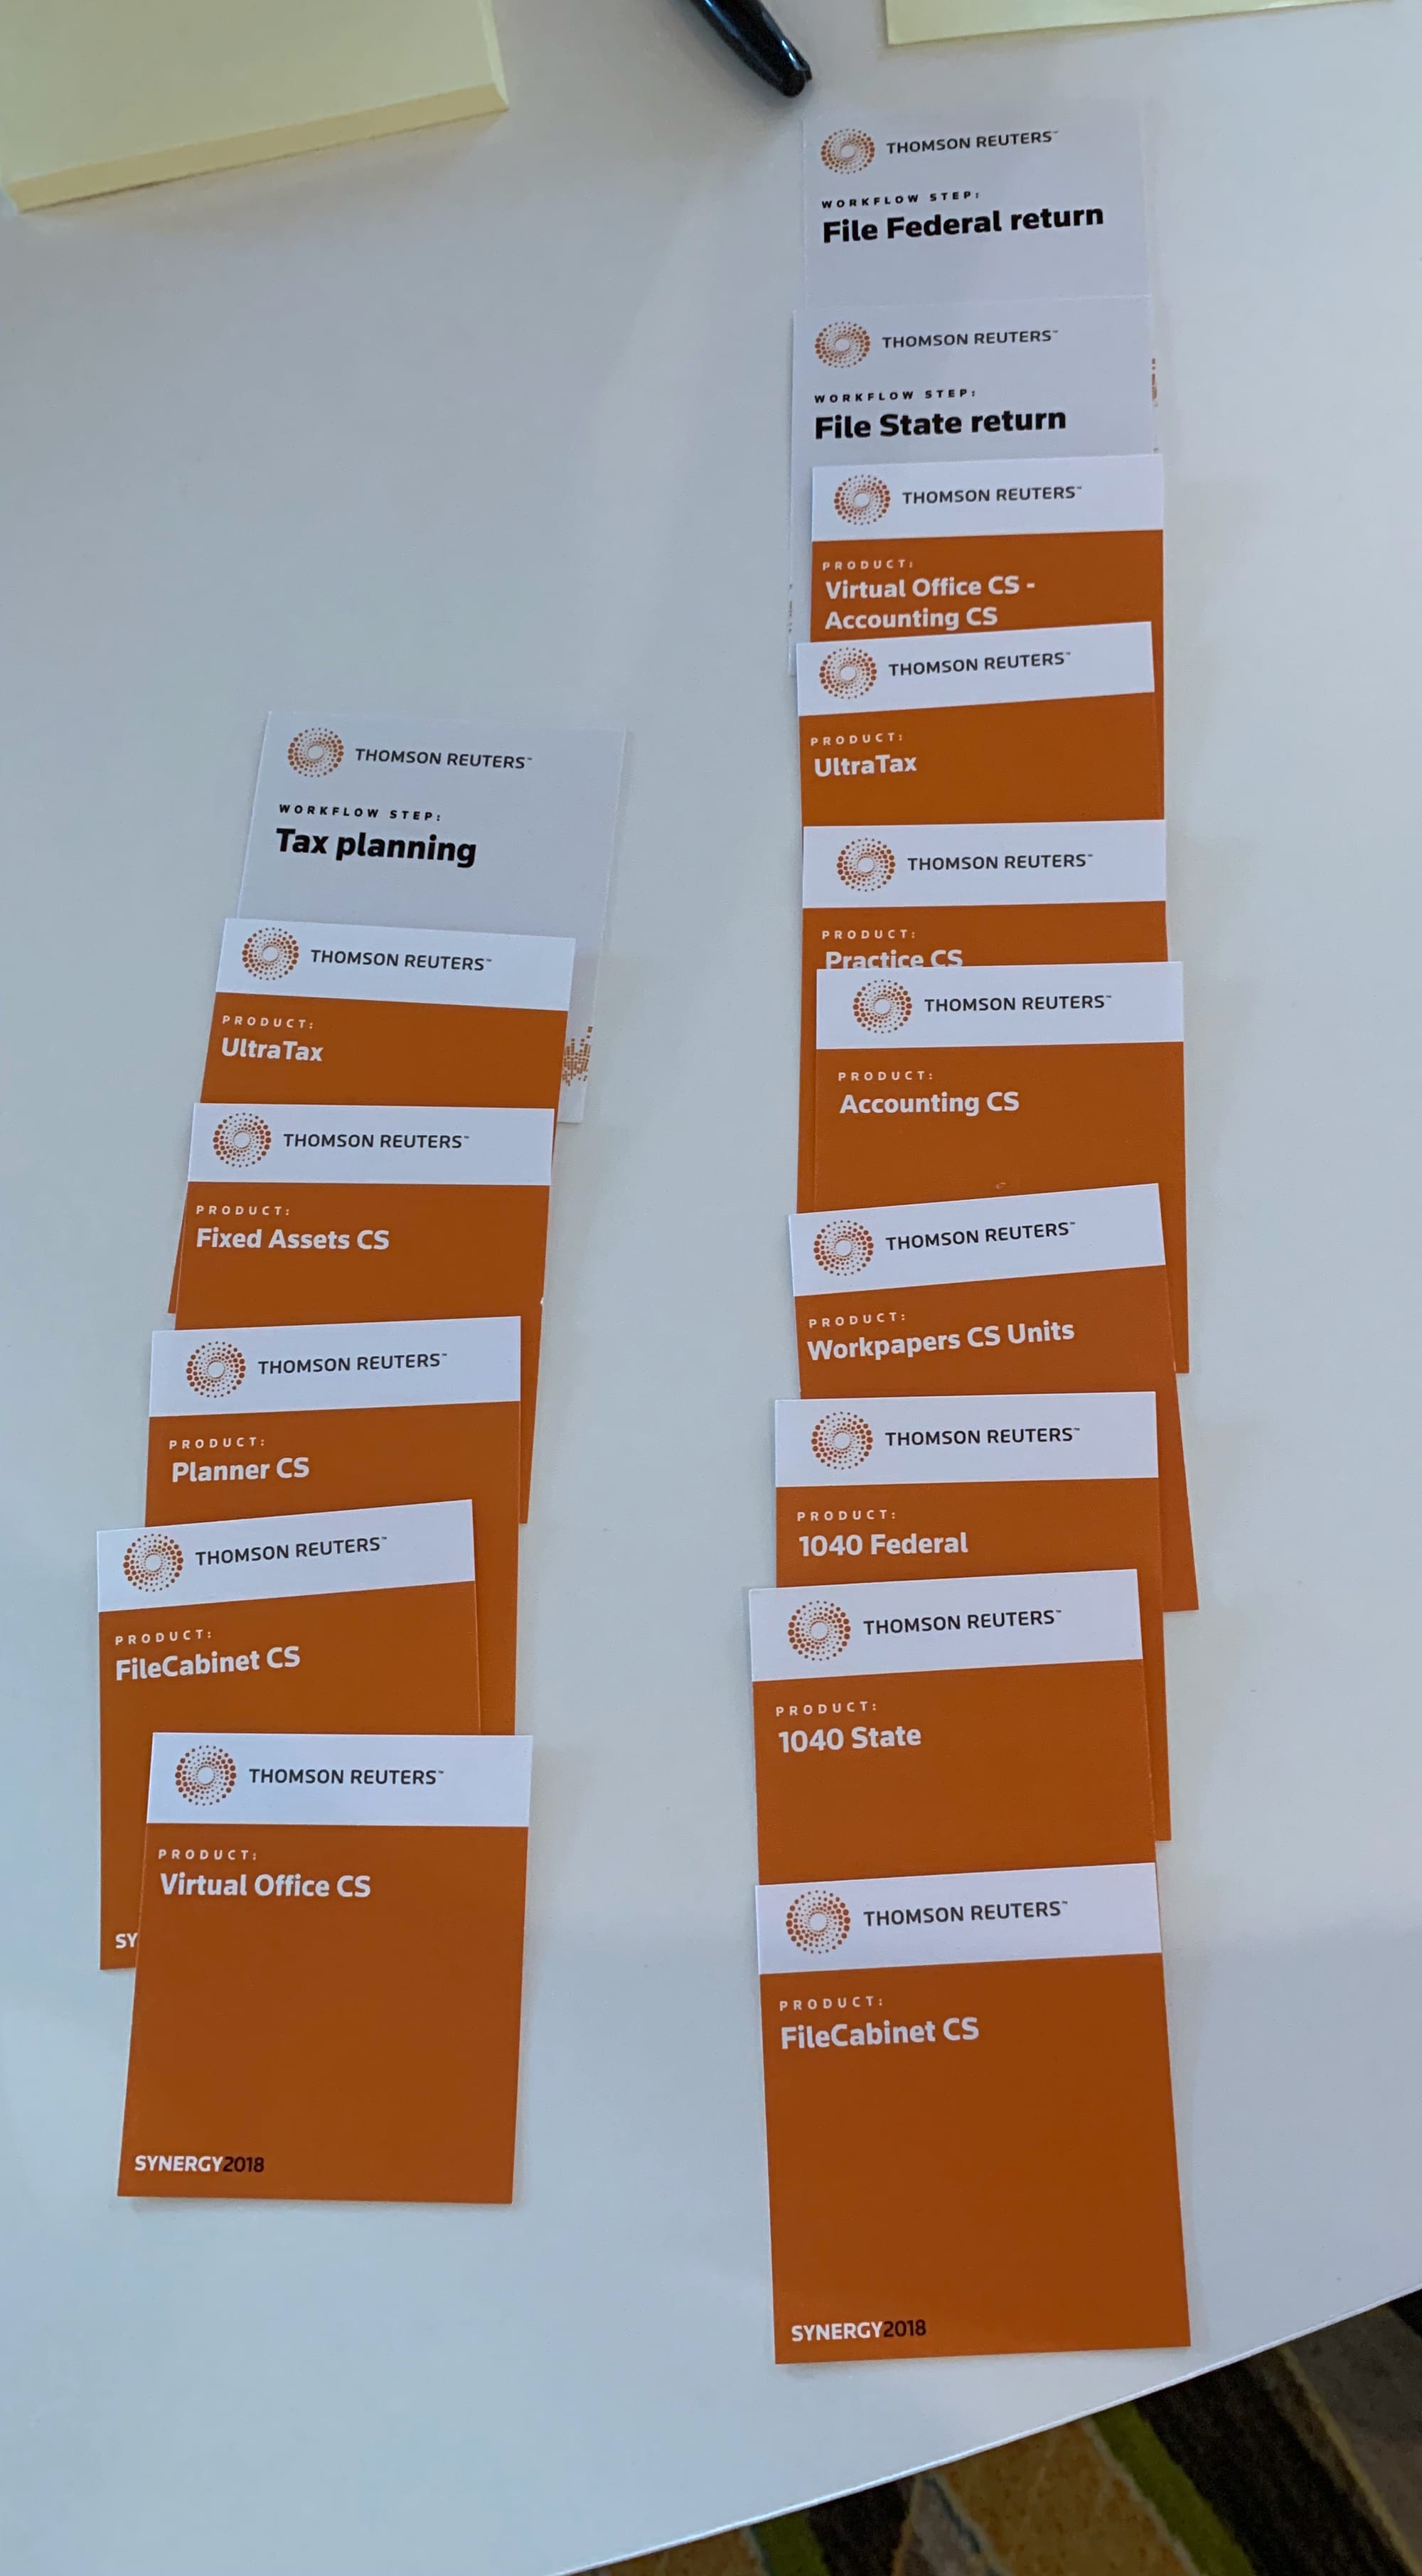
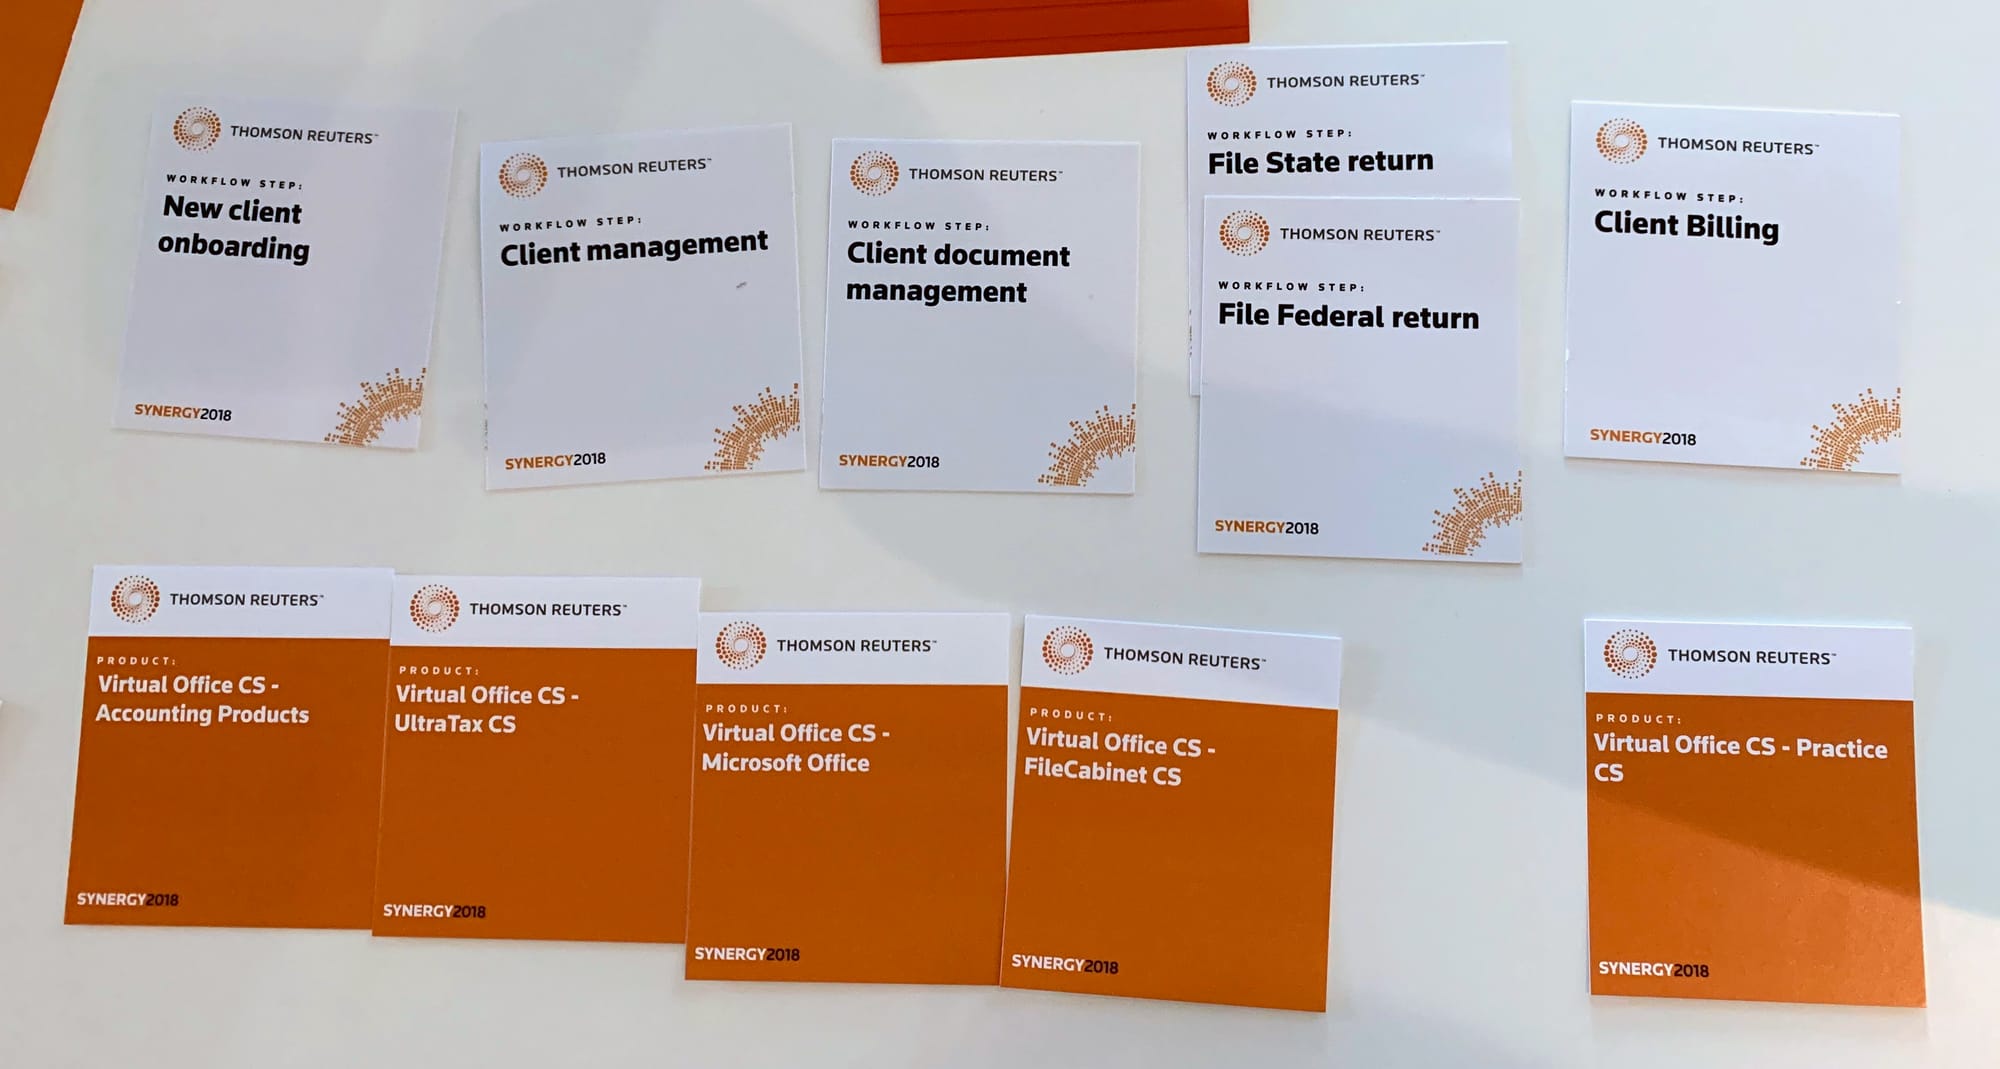
Left: few tasks, but a lot of products; Right: more tasks with fewer products
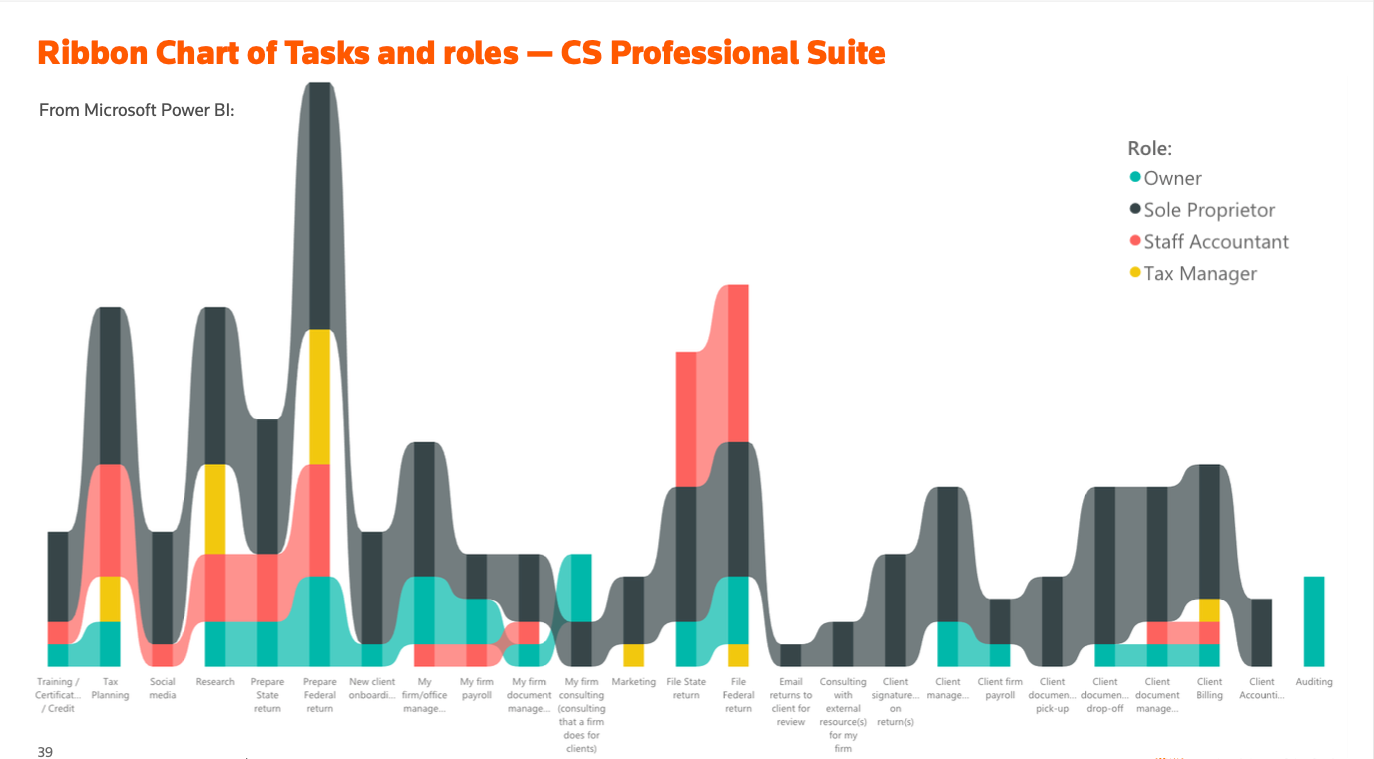
Each respondent reported their role in their respective firm. Four types of roles were reported:
- Owner - 3 participants; 6-16 tasks; 12 average tasks; 15 products used on average
- Sole Proprietor - 8 participants; 4-20 tasks; 13 average tasks; 27 products used on average
- Staff Accountant - 3 participants; 4-9 tasks; 7 average tasks; 15 products used on average
- Tax Manager - 1 participant; 8 tasks; 14 products used
This would provide an additional set of data for comparison and help having another vector to sort the data. For example, looking at product usage, Sole Proprietors stood out almost doubling the other roles’ product usage.
Results & Findings
Types of work
The initial pass through the data revealed that participant’s workflows had some groupings of certain types of tasks:
- Client work – such as onboarding new clients, document management and research; more administrative and focused on setting up a client than doing any of the work the client hired them to do
- Firm work – such as office management, client billing, payroll, new client acquisition; also administrative, focused on firm operations
- Core work – such as preparing and submitting federal and state tax returns, tax planning and research
When the data was analyzed more deeply, the order of tasks showed that Client and Firm tasks bookended Core tasks, with a majority of participants indicating Client tasks within the first three tasks in their workflows.
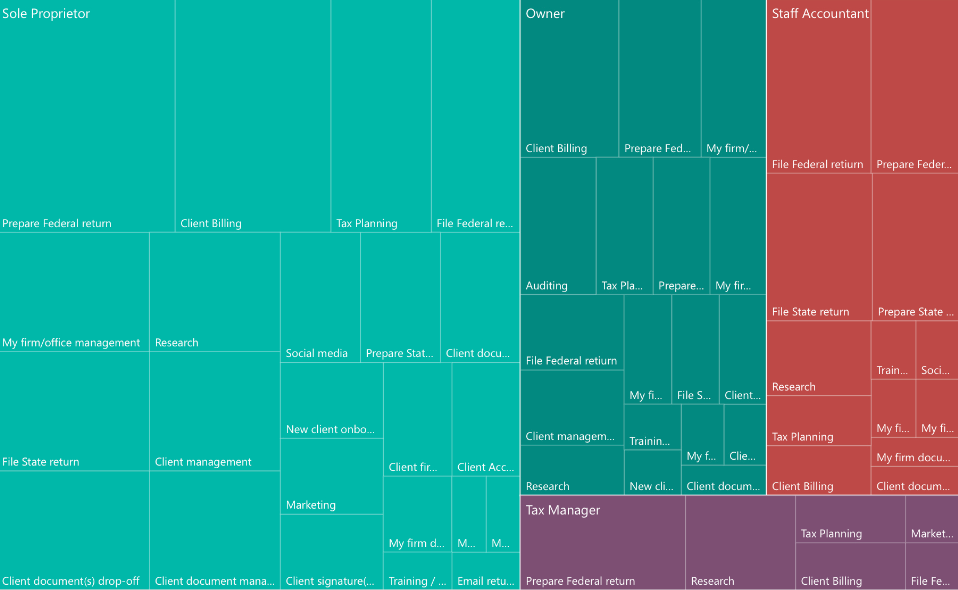
Workflow analysis
- 80% of participants performed the following:
- Client billing
- Preparing & filing federal tax returns
- 67% of participants perform research
- 60% of participants prepare and file state tax returns
- 50% of participants perform client document management
- 47% of participants perform office management tasks
- 40% of participants handled their client’s payroll
I created whisker charts to display task timelines and any groupings. Where the x-axis showing number of tasks for a participant and the dot indicating timeline position relevant to number of tasks. Here is a small sample of client work tasks and where they occurred on participant timelines:
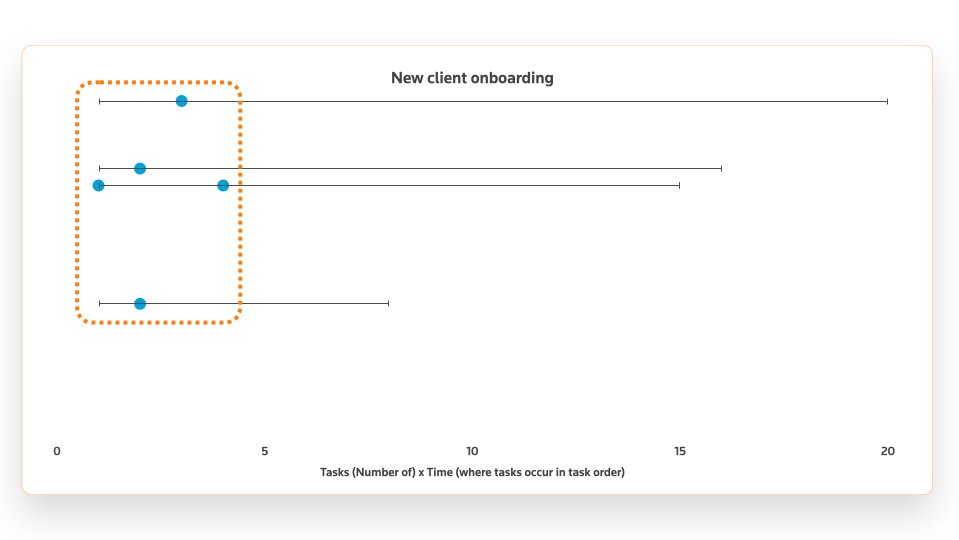
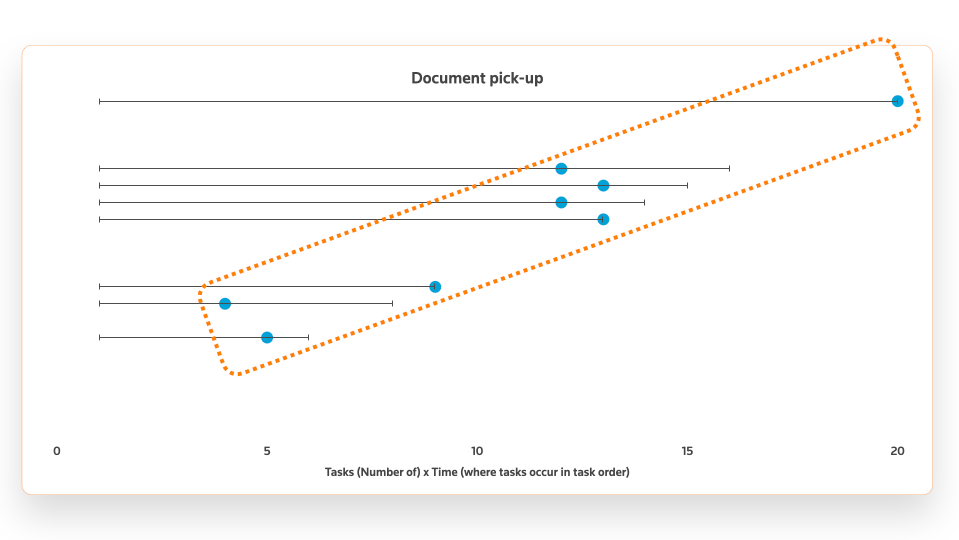
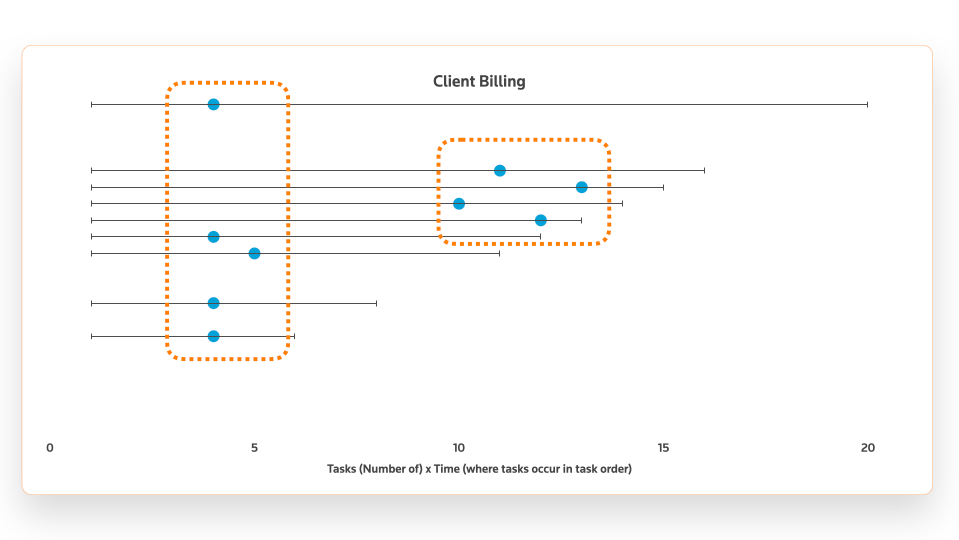
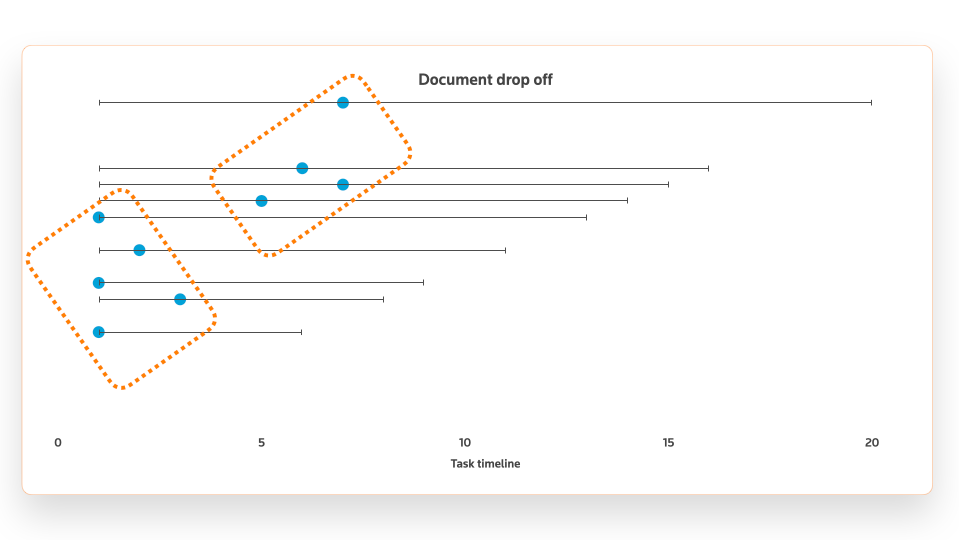
Each horizontal line represents a single respondent. The length of the line indicates the number of tasks they reported.
Product usage
As expected, the most popular products in the research correlated with sales data. The biggest surprise was the correlation of users mentioning QuickBooks Pro. This was their most common non-Thomson Reuters product and the one they wanted integrations for the most. Product owners validated these findings as a long-standing request from users, but I had no idea prior to the test, so a nice way to quantify an outside product use.
The average products used by participants to get their work done was shockingly high at 17.5. While some of those products were grouped into product suites, participants didn’t see the suite, just the individual product they used.
Workflow Insights
The very deep product offering from the business contributes to participants taking multiple paths through their workflow; in other words, having more than one way to perform a task. There was no “normal” or “baseline” workflow that emerged from the data. However, there were some product and task timeline groupings that could provide insight on when a customer might be more open to hearing about new product features or new products.
Most participants said as long as new features/products weren’t shown in an interruptive or interstitial way, they’d welcome learning about new features. Whether that would bear out during a busy tax season under deadline pressure would be something else to track going forward.
For client work, an integration with QuickBooks was highly desired. Virtually every participant who performed client tasks mentioned QuickBooks. When reporting to product stakeholders, they were very aware of this desire and the data from this study correlated to past customer requests.
Outcomes & Recommendations
- Using the task types Client, Core and Firm, it will be possible to create relevant messaging while someone is using the products.
- Role-based messaging will prove advantageous, especially for customers identifying as Sole Proprietors, especially with empathetic messaging and/or time saving feature updates.
- In order to simplify the product line and improve customer notifications, more customer interviews would need to be performed to discover how best to quantify product usage and plan both lifecycle and migration paths for customers.
- There is a well-indicated need to strengthen external product integrations, especially QuickBooks.
- More research is needed to more fully understand customer workflows, this should be an ongoing project.
